The response times of (for example) your web pages or mobile applications can be plotted in real-time once our monitoring solution is connected to your systems.
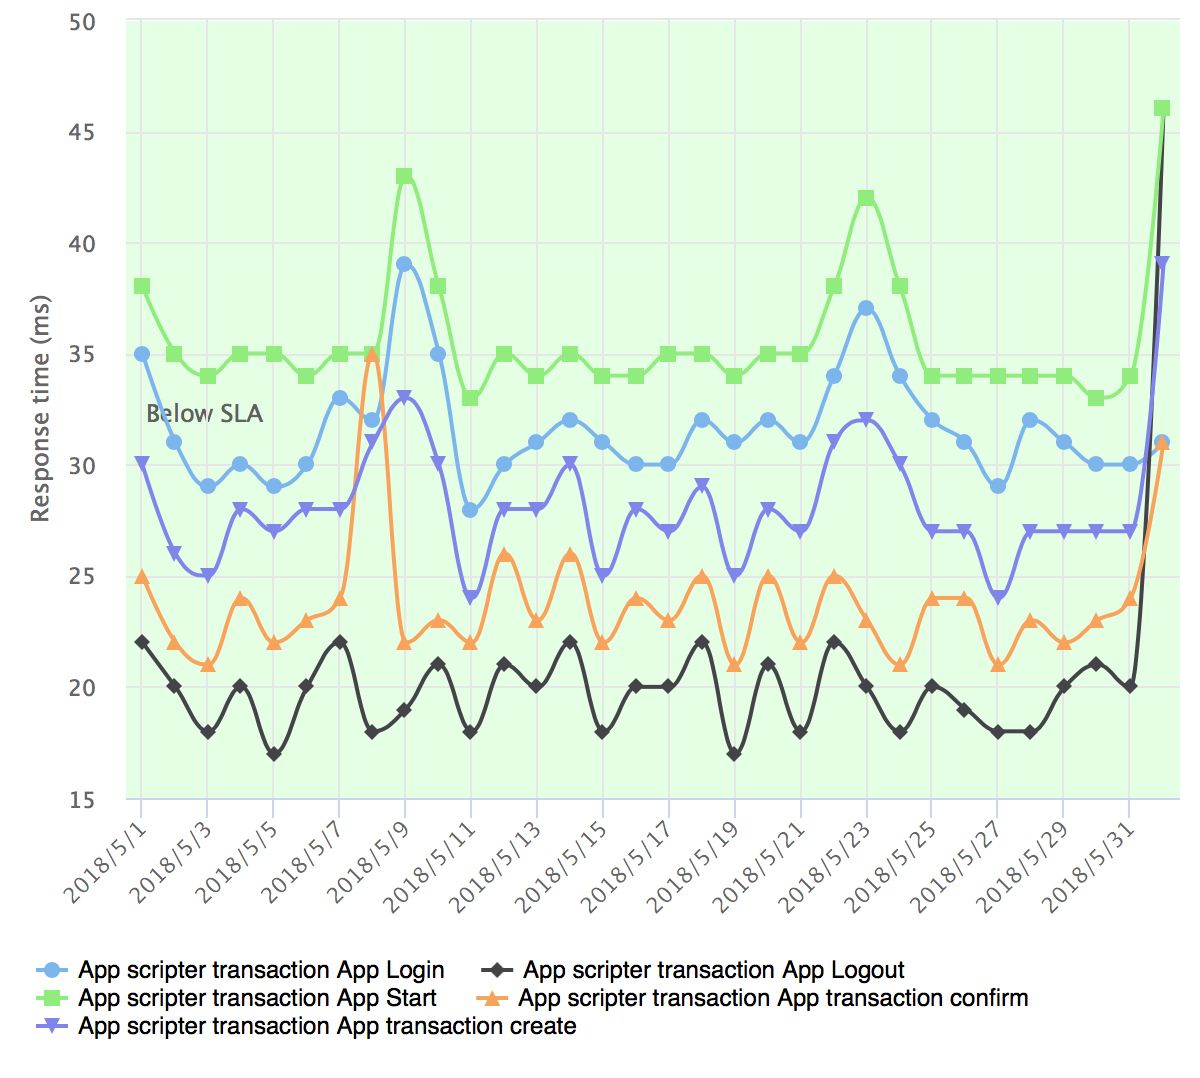
Since all historical data is archived, you can also create several other graphs. You can compare days, weeks and months with different timeframes and show trends.
Last but not least, the real SLA measurement can be plotted and investigated.