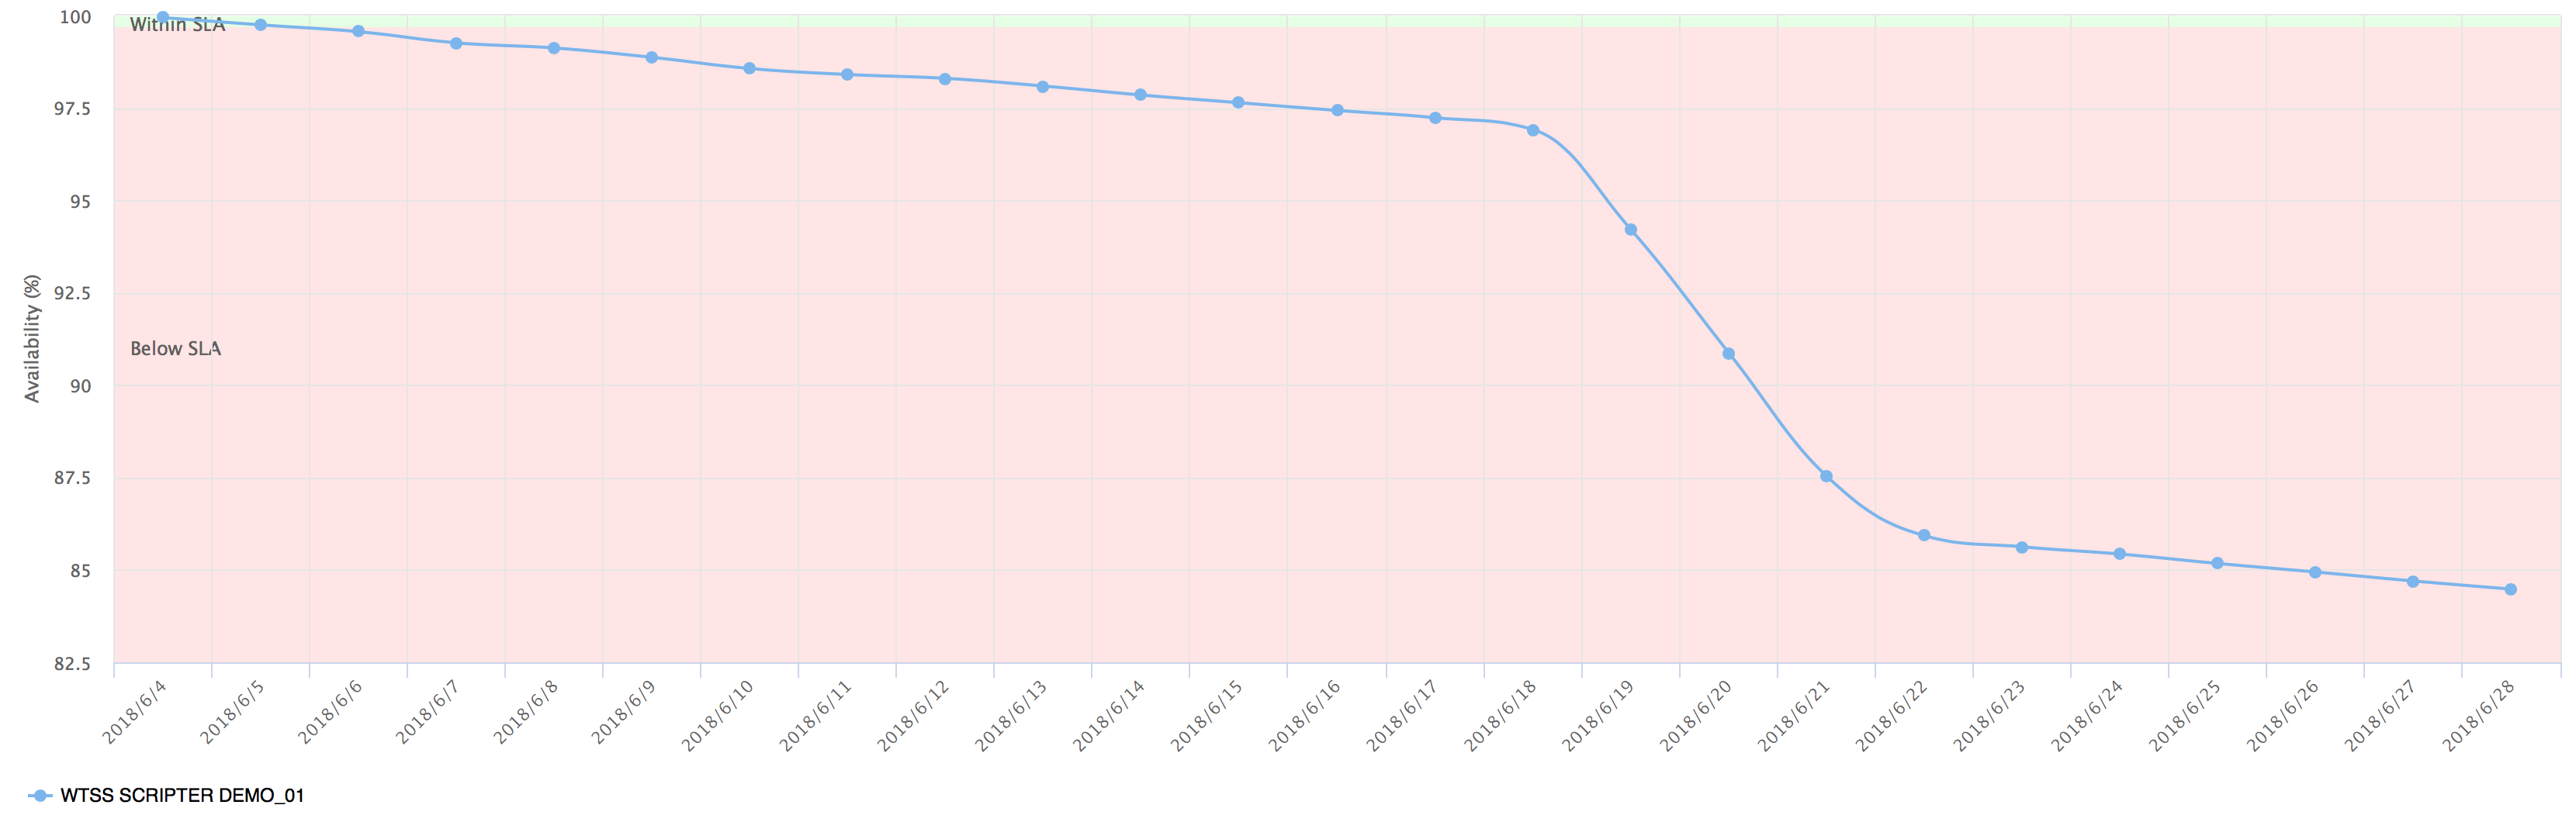
Your SLA details can be plotted in real-time once our monitoring solution is connected to your systems. By using sophisticated algorithms, we can measure the impact of detected errors and lower the SLA accordingly. The result can be a waterfall graph depicting the SLA level starting at a specific moment until the last measurement as shown below.
Since all historical data is archived, you can also create several other graphs. You can compare days, weeks and/or months with different timeframes and show trends. It can also guide your development and operation teams on the 'available downtime' in a certain period to help decide on the implementation of changes.
Last but not least, Response time measurement can be plotted and investigated.